⏰ Estimated Time: 1 minute
Assessments
- Select a student from the Risk Analysis or Students (student search) dashboards.
- Click Assessments on the left panel.
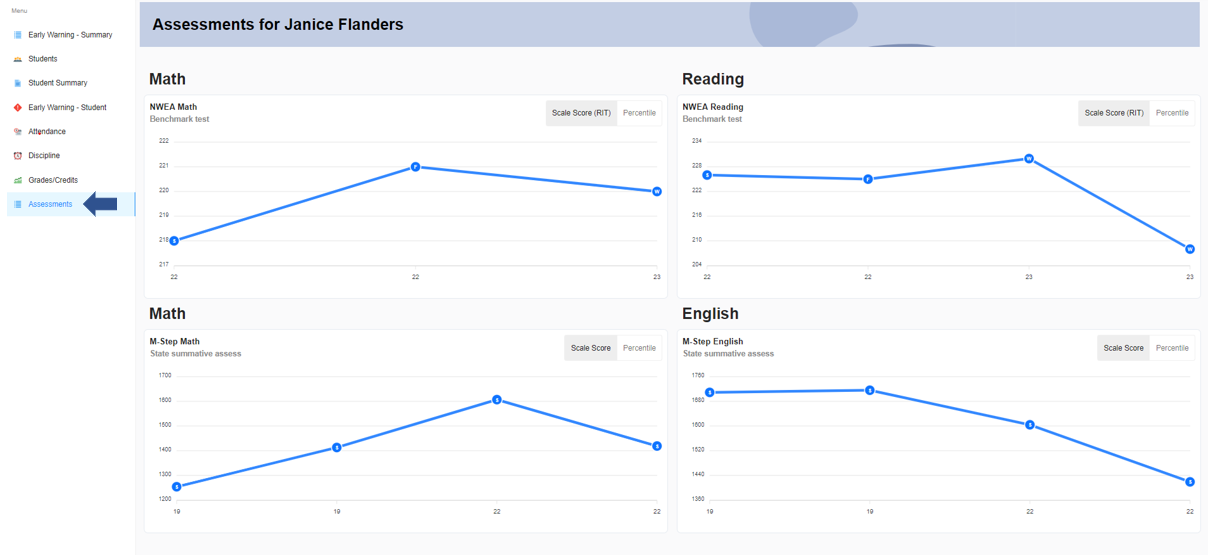
- The dashboard displays the student's state and benchmark assessment results over time.
- Benchmark assessments are displayed at the top of the dashboard since they are administered more frequently. State assessments appear next.
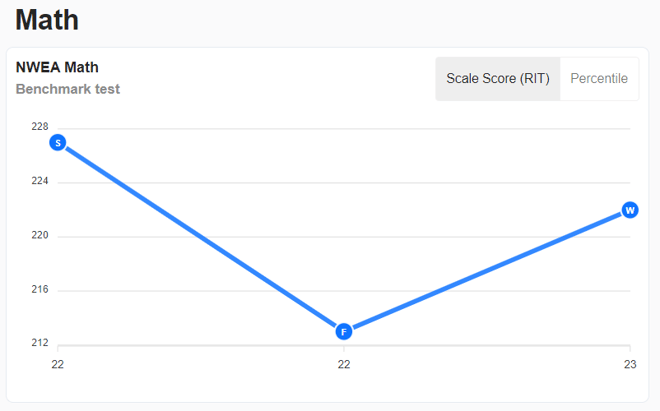
- Click Scaled Score tab to view the student's test score for each term.
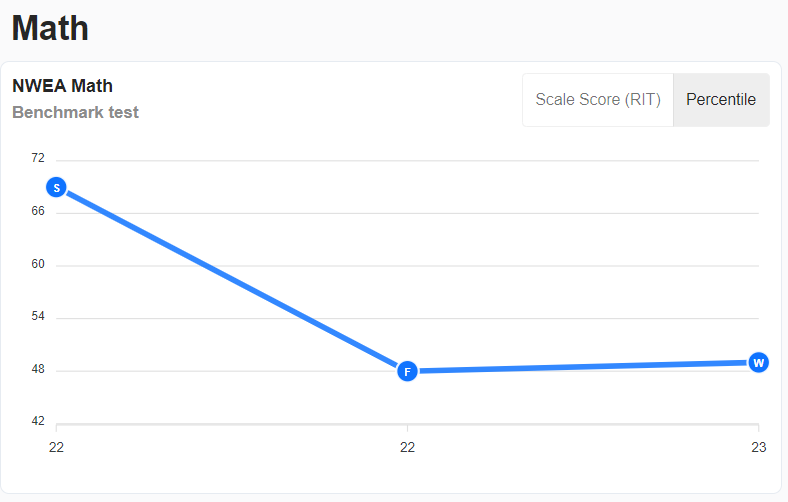
- Click Percentile tab to view the student's percentile for each term.
Interpreting the Assessment Graph
- The assessment displays the benchmark score along the Y-axis and the year the test was taken across the X-axis.
- The blue circle denotes the test score for the term and year it was taken.
- F = Fall
- W = Winter
- S = Spring
- The score will reflect the assessment taken. For example, students taking the NWEA MAP assessment will have RIT scores displayed while students taking Curriculum Associates i-Ready or Renaissance Learning STAR will have scale scores displayed.
- State assessments are usually administered once per year and therefore will only reflect one term for the year.
- Click the Percentile tab to see the student's trend by test percentile.
- Everything will remain the same, however the Y-axis will update to reflect test percentiles.
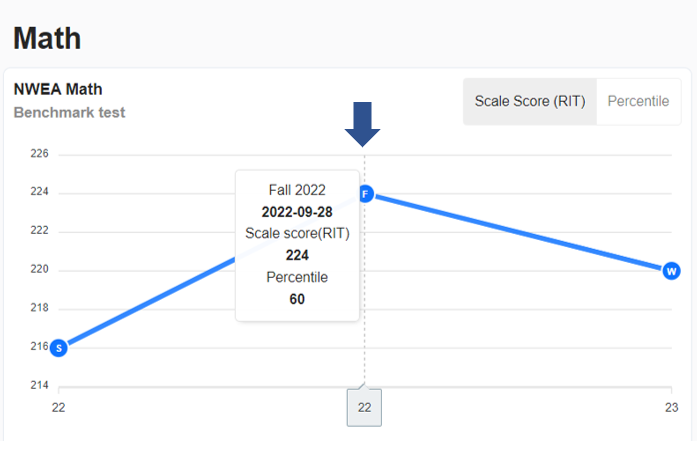
Hover over the term/year to view details about the test date, test score, and test percentile.